Perf and friends
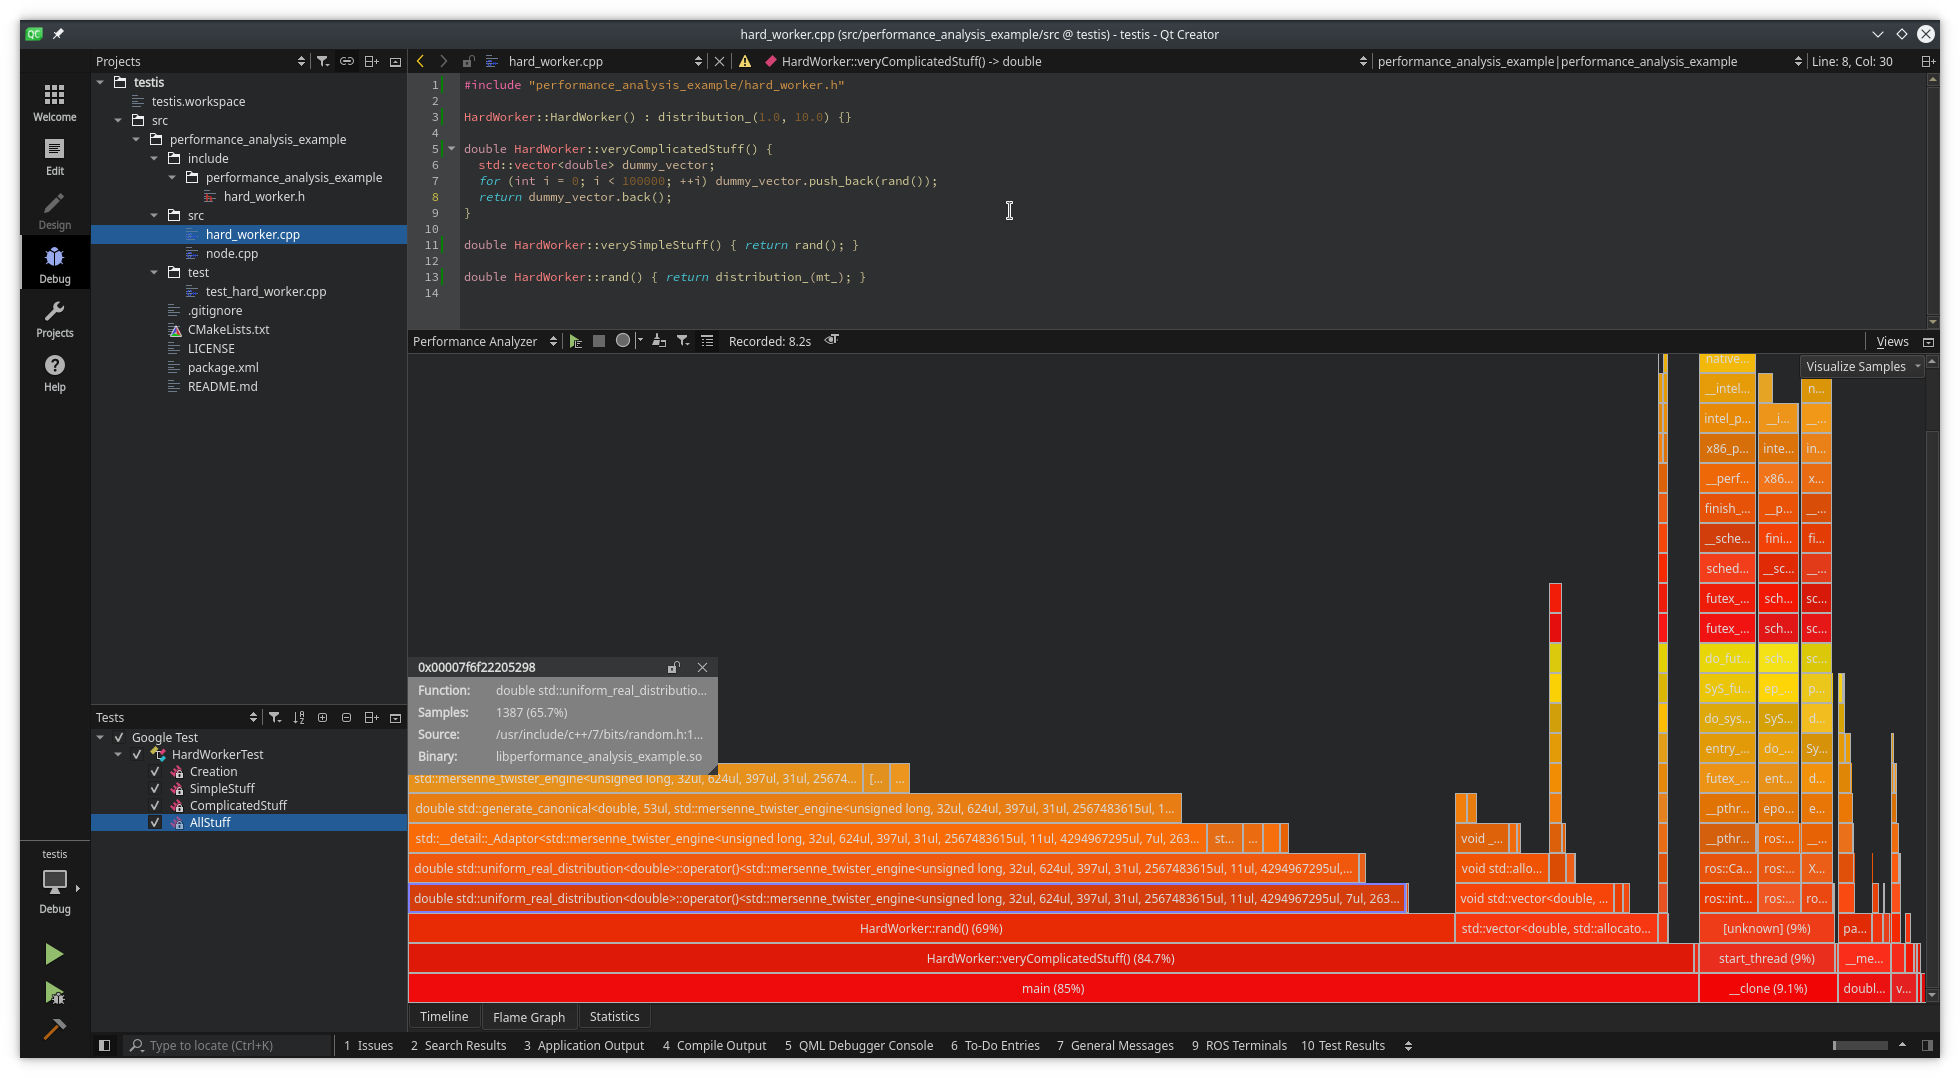
There is a tool called perf that can collect data of the system. This can be targeted to collect data of your program and then parse that dump of data to be visualized. The parser is called perfparser from the Qt people and, along with it, they have also developed a plugin to visualize data directly in the IDE as shown in the image below. However this data can be visualized with other programs as the KDAB people show with the project Hotspot.
System setup
- Install perf. In Ubuntu like systems:
sudo apt install linux-tools-common linux-tools-generic
- Allow to run perf system wide by running. If is the first time, reboot:
echo -e "kernel.perf_event_paranoid=-1\nkernel.kptr_restrict=0" | sudo tee /etc/sysctl.d/10-perf.conf
If by running cat /proc/sys/kernel/kptr_restrict the result is 0, the permissions are set right.
QtCreator Setup
Install Qt Creator with the ROS plugin by dowloading the latest version.
Setup the workspace in QtCreator
Compile (Shortcut with Ctrl+B)
Add the custom executable. With catkin, all executables are outputed under <workspace>/devel/lib/<my_package>. We will create a configuration in QtCreator so it can use it. We will rename the custom executable to make it easier to find and use afterwards.
Performance analysis
- Go to the debug view.
- Select the custom executable created before from the bottom left menu.
- Change the tool to Performance Analyzer
- Start the debug session with the play button. The program should run.
- Start recording data by pressing the grey circle.
- Stop recording data by pressing the red circle again. Red means that is recording.
- Stop the node (if you want to, this step assumes free will).
- Et voila! You can visualize your data, a very useful view is the Flame graph.
In the gif below it can be seen how the veryComplicatedStuff function is taking 85% of the execution of the process.
Bonus: Running tests from QtCreator
Qt Creator also supports Google Tests natively and you can, not only run an specific test from the IDE but also debug it!. To do so:
Compile the tests with catkin run_tests <my_package>. This will generate a binary with the tests.
Add the custom executable. As before, create a custom executable but, this time, the target should be the previously generated binary.
Go the Tests view and make use of it.
When running the tests, it will ask about which Custom executable to use. Select the one created right now.